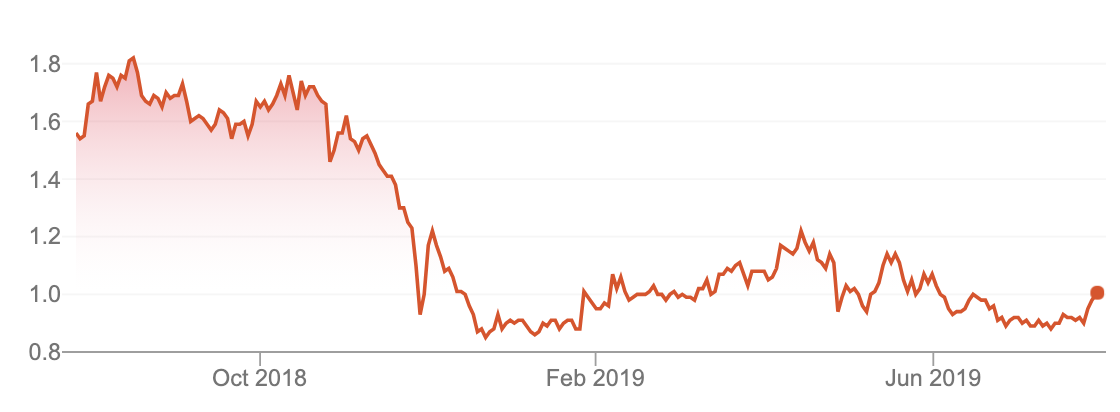
The Redbubble Ltd (ASX: RBL) share price popped as much as 24% higher today after the technology and retail business released an ASX update to investors.
Redbubble Share Price
Redbubble is an Australian online retail marketplace business specialising in customised graphic design and speedy fulfilment of orders. It has relationships with fulfillers around the world who process orders for freelance artists and users who are seeking products such as custom t-shirts, mugs, cups, posters and lots more. Redbubble was founded in 2006.
Redbubble’s ASX Update
In its ASX update today, Redbubble announced that its marketplace revenue grew by 41% year-over-year in its 2019 financial year, with $3.8 million in operating EBITDA (see the video below for an explanation).
Impressively, Redbubble said it is driving towards $1 billion in sales over the long run as more artists, users and fulfilment centres embrace to its independent creative ecosystem. During the year, Redbubble made a strategic acquisition in buying TeePublic.
Per the update, the company said revenue was up in the existing rebubble.com business amongst its ‘authentic sellers’ but from what I could see the company did not provide enough clarity on the performance of total users solely on the rebubble.com website. Meaning, I’m struggling to determine if the combined group’s growth has come simply by bolting two companies together or if the core/legacy business is actually growing (or in decay)?
Zooming out a bit and in 2019 Redbubble achieved a gross profit of $95 million, up 41%, as it maintained a margin of 36.8%. A strong gross margin, which effectively measures revenue less necessary costs, is often a sign of a strong business model.
However, turning to the all-important cash flow statement and Redbubble generated cash flow from operations of $2.6 million during the final quarter and $5.5 million for the year. If capitalised development costs are treated as necessary then by my calculations the company produced quarterly and yearly negative free cash flow of $150,000 and $4.3 million, respectively.
I’d be carefully watching the estimated cash flows and forecast expenses/costs associated with advertising/marketing, research & development (R&D) and capitalised development in the next reporting period. In a market of fierce competition with the likes of Amazon, Etsy, Facebook Marketplace and other unique destinations marketing and user experience will be important for Redbubble, in my opinion.
What Now?
I really like the idea of Redbubble’s independent artist marketplace business and supposed cash flow flywheel. I have used Redbubble’s services both as an everyday user and as a potential investor in its shares and followed the company for quite some time.
However, following the issues with changes to Google’s search algorithms then the acquisition of TeePublic I’ve become warier of its long term organic growth potential. I hope it continues to grow but I’m not a buyer of its shares for the long run today.
[ls_content_block id=”695″ para=”paragraphs”]
Disclosure: At the time of publishing, Owen owns shares of Alphabet/Google and Facebook.