One of the common questions we come across at Best ETFs Australia is which Australian Index Fund should I choose for my ASX portfolio?
With several ETF providers, each with varying fees, size, spreads, and performance, what seemed like a straightforward question becomes a minefield to answer.
Fortunately, we’re here to ease that burden with a comprehensive review of broad-based Australian Index Funds available to investors. Further down the page we've also included links to our free reports on each of the ETFs!
Before beginning the analysis, we will first define what we mean by an Australian Index Fund.
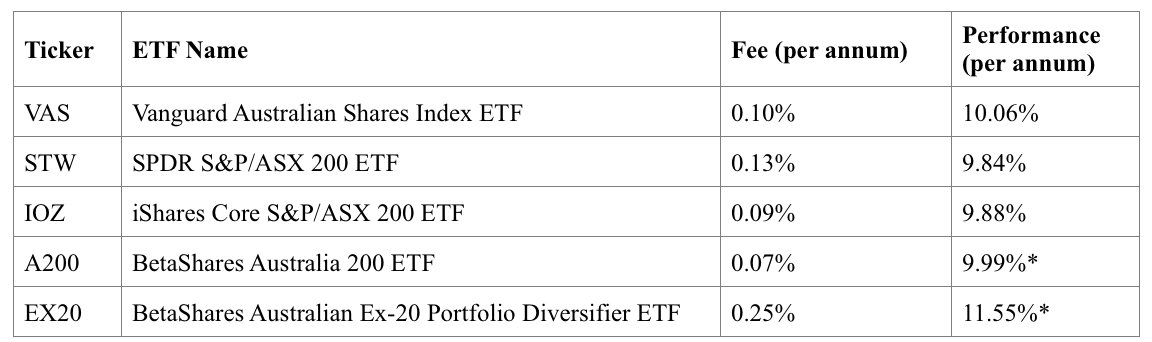 Source: Best ETFs data, December 2020
*The two BetaShares ETFs have a shorter window of actual performance, thus the index return is utilised.
The key takeaway when purchasing an ETF, especially in the case of similar or identical funds, is to review the management fee and performance as this will be the primary driver of future returns. This is discussed in more detail below.
Performance is annualised, meaning it is the average per year over the past five years. To illustrate, $10,000 invested in STW five-years ago would have resulted in $15,998 today, assuming distributions were reinvested.
Given STW, IOZ and A200 effectively track the same basket of companies (the 200 largest companies on the ASX) their performance, in theory, should be identical. As you can see in the above table, it is not.
The primary reason for the difference in performance between the three ETFs is the management fees. While A200 performance tops both, keep in mind this is before fees.
In our review, IOZ pipped STW by 4 basis points (0.04%) per annum in performance, the exact difference in fees. This may seem like only a modest difference, however over a long holding period this difference in fees can add up.
Let’s assume you purchase $10,000 each of IOZ and STW and hold for 40 years. Additionally, let’s assume the five-year return is applicable for the 40-year holding period (obviously, past performance is not indicative of future performance).
At the end of that 40 years, your investment in IOZ will be worth an extra $6,264 compared to STW – not an insignificant sum - because of fees.
VAS outperforms all three, by a margin of between 7-22 basis points, demonstrating that including smaller companies can lead to outperformance.
Again, using our 40-year holding period example, $10,000 in VAS would have led to an additional return of $29,315 compared to IOZ. What initially seemed a marginal outperformance adds up to a tidy five-figure sum.
EX20 is the best performer over the past five-years, again supporting the premise smaller companies outperform their larger peers.
To drive home the point, again using our hypothetical example, $10,000 over 40 years in EX20 would lead to an extra $421,020 before fees compared to VAS, despite a seemingly 1.49% difference in performance
You might be asking why such small differences in performance and fees lead to such outsized results in return.
The answer: the power of compounding.
Source: Best ETFs data, December 2020
*The two BetaShares ETFs have a shorter window of actual performance, thus the index return is utilised.
The key takeaway when purchasing an ETF, especially in the case of similar or identical funds, is to review the management fee and performance as this will be the primary driver of future returns. This is discussed in more detail below.
Performance is annualised, meaning it is the average per year over the past five years. To illustrate, $10,000 invested in STW five-years ago would have resulted in $15,998 today, assuming distributions were reinvested.
Given STW, IOZ and A200 effectively track the same basket of companies (the 200 largest companies on the ASX) their performance, in theory, should be identical. As you can see in the above table, it is not.
The primary reason for the difference in performance between the three ETFs is the management fees. While A200 performance tops both, keep in mind this is before fees.
In our review, IOZ pipped STW by 4 basis points (0.04%) per annum in performance, the exact difference in fees. This may seem like only a modest difference, however over a long holding period this difference in fees can add up.
Let’s assume you purchase $10,000 each of IOZ and STW and hold for 40 years. Additionally, let’s assume the five-year return is applicable for the 40-year holding period (obviously, past performance is not indicative of future performance).
At the end of that 40 years, your investment in IOZ will be worth an extra $6,264 compared to STW – not an insignificant sum - because of fees.
VAS outperforms all three, by a margin of between 7-22 basis points, demonstrating that including smaller companies can lead to outperformance.
Again, using our 40-year holding period example, $10,000 in VAS would have led to an additional return of $29,315 compared to IOZ. What initially seemed a marginal outperformance adds up to a tidy five-figure sum.
EX20 is the best performer over the past five-years, again supporting the premise smaller companies outperform their larger peers.
To drive home the point, again using our hypothetical example, $10,000 over 40 years in EX20 would lead to an extra $421,020 before fees compared to VAS, despite a seemingly 1.49% difference in performance
You might be asking why such small differences in performance and fees lead to such outsized results in return.
The answer: the power of compounding.
 VAS, STW, IOZ, and A200 have tight spreads. EX20 is wider (worst).
Similar to FUM, despite a relatively higher spread to its four peers, it’s not a huge issue for EX20. However, it is worth keeping in mind.
VAS, STW, IOZ, and A200 have tight spreads. EX20 is wider (worst).
Similar to FUM, despite a relatively higher spread to its four peers, it’s not a huge issue for EX20. However, it is worth keeping in mind.
So what exactly is an Australian index fund?
Firstly, the ETF must represent a broad basket of shares domiciled on the Australian Stock Exchange (ASX), the primary exchange for securities in Australia. Some companies you may recognise include Commonwealth Bank of Australia (ASX: CBA), Afterpay Limited (ASX: APT), and Woolworths Group Ltd (ASX: WOW). Secondly, the ETF must track an index that is passive and not actively managed. For an explanation of the difference between active and passive investing strategies, check out this video on Active Versus Passive: know the difference. The five ETFs which meet our criteria of a broad-based Australian Index Fund for shares are:- Vanguard Australian Shares Index ETF (ASX: VAS)
- iShares Core S&P/ASX 200 ETF (ASX: IOZ)
- SPDR S&P/ASX 200 ETF (ASX: STW)
- Betashares Australia 200 ETF (ASX: A200)
- BetaShares Australian Ex-20 Portfolio Diversifier ETF (ASX: EX20)
Top index funds in Australia
IOZ, STW, and A200 do what they say on the box – track an index that mirrors the largest 200 companies listed on the ASX. What makes a share ‘large’ you ask? It’s based on the market capitalisation of the company, which is finance lingo for the total value of all the outstanding shares. In this case of VAS, the index follows the 300 largest companies. This allows investors to gain exposure to an additional 100 companies which are ranked 201-300 by market capitalisation, compared to IOZ, STW, and A200. The companies ranked 201-300 are often-termed small caps (short for small capitalisation) as they are smaller than the initial 200 companies included. Generally speaking, smaller companies offer greater opportunity for growth leading to potentially higher returns, however, are considered to be more risky investments. The opposite is true for large capitalisation (think stocks ranked 1-20) shares, which usually offer lower growth prospects and less risk. For those looking for a diversified ETF with small-cap exposure, look no further than VAS. EX20 methodology is similar to IOZ, STW, A200 by including the largest 200 companies. However, the ETF differs from its peers by removing the 20 largest shares, which comprise roughly 60% of the top 200 companies on the ASX, creating an index that consists of stocks ranked 21-200 by market capitalisation. By removing the 20 largest stocks, significantly alters the composition of the index. Sector weightings in Information Technology and Industrials increase at the expense of lower exposure to Financials and Mining. Those which already have exposure to the Big 4 Banks and major minors may prefer to opt for EX20 as a means of reducing overlap.Fees & Performance
Source: Best ETFs data, December 2020
*The two BetaShares ETFs have a shorter window of actual performance, thus the index return is utilised.
The key takeaway when purchasing an ETF, especially in the case of similar or identical funds, is to review the management fee and performance as this will be the primary driver of future returns. This is discussed in more detail below.
Performance is annualised, meaning it is the average per year over the past five years. To illustrate, $10,000 invested in STW five-years ago would have resulted in $15,998 today, assuming distributions were reinvested.
Given STW, IOZ and A200 effectively track the same basket of companies (the 200 largest companies on the ASX) their performance, in theory, should be identical. As you can see in the above table, it is not.
The primary reason for the difference in performance between the three ETFs is the management fees. While A200 performance tops both, keep in mind this is before fees.
In our review, IOZ pipped STW by 4 basis points (0.04%) per annum in performance, the exact difference in fees. This may seem like only a modest difference, however over a long holding period this difference in fees can add up.
Let’s assume you purchase $10,000 each of IOZ and STW and hold for 40 years. Additionally, let’s assume the five-year return is applicable for the 40-year holding period (obviously, past performance is not indicative of future performance).
At the end of that 40 years, your investment in IOZ will be worth an extra $6,264 compared to STW – not an insignificant sum - because of fees.
VAS outperforms all three, by a margin of between 7-22 basis points, demonstrating that including smaller companies can lead to outperformance.
Again, using our 40-year holding period example, $10,000 in VAS would have led to an additional return of $29,315 compared to IOZ. What initially seemed a marginal outperformance adds up to a tidy five-figure sum.
EX20 is the best performer over the past five-years, again supporting the premise smaller companies outperform their larger peers.
To drive home the point, again using our hypothetical example, $10,000 over 40 years in EX20 would lead to an extra $421,020 before fees compared to VAS, despite a seemingly 1.49% difference in performance
You might be asking why such small differences in performance and fees lead to such outsized results in return.
The answer: the power of compounding.
Distributions (Dividends)
When a company held by the ETF pays a dividend, this is passed on to you as a distribution. In the past 12 months, each of the ETFs paid a distribution ranging from 2.27% to 2.68%. If you invested $10,000, this would be an annual payout between $227 to $268. Unless you are specifically looking for income, the distribution is not particularly important. What matters is the total return, which includes distributions plus the capital appreciation of the ETF (and the underlying shares held).FUM
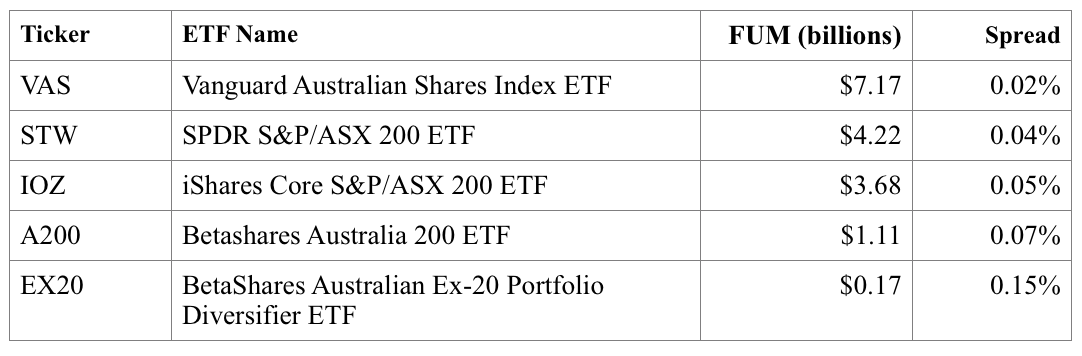
Funds under management or FUM for short may not be front of mind when deciding between ETFs but it’s important for two reasons. First, greater FUM often leads to better liquidity. This will be further explored under Spread, below, but in simple terms, the greater the FUM, the more likely there are more buyers and sellers of the ETF you are looking at. This active buying and selling reduces the difference between what a buyer is willing to pay and what a seller is willing to sell for. Secondly, an ETF with a large amount of FUM safeguards against the ETF being closed by the issuer. Think about it from the issuer’s perspective. Each ETF needs to have a certain level of FUM to be profitable for them to operate. If the FUM is too low, then it unlikely the issuer will continue with the product. Given STW, VAS and IOZ have been around for over a decade and each has at least $3 billion in FUM, they won’t be going anywhere. The same is true for A200, which has grown FUM to over $1 billion since 2018. EX20 however has roughly $167 million FUM, significantly less than its peers. Despite the lower FUM, I don’t believe this ETF will be closed anytime soon. Nonetheless, it’s worth keeping an eye out for – especially with newer ETFs.Spread
Spread is short for 'bid-ask spread'. What the buyer is willing to pay (bid) and what the seller is willing to sell for (ask). The closer this gap, the better. Put another way, tighter = better. Generally, lower spreads correlate with higher FUM. This is illustrated below.
VAS, STW, IOZ, and A200 have tight spreads. EX20 is wider (worst).
Similar to FUM, despite a relatively higher spread to its four peers, it’s not a huge issue for EX20. However, it is worth keeping in mind.