Australian ETF Comparison: FAIR vs IOZ

There is a variety of options for investors looking to gain exposure to the Australian stock market. Two of those options is the iShares Core S&P/ASX 200 ETF (ASX: IOZ) and BetaShares Australian Sustainability Leaders ETF (ASX: FAIR).

Investment Strategy

IOZ is a vanilla ETF product with a relatively straightforward investment strategy. The ETF consists of the 200 largest companies listed on the Australian Stock Exchange measured by market capitalisation.
FAIR is a little more complex, tracking the performance of an index that excludes Australian companies with direct or significant exposure to unethical industries or operations.
FAIR Investment process. Source: BetaShares Fair Flyer

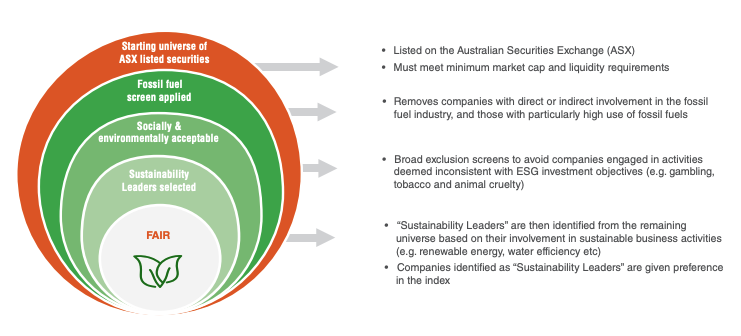
The ETF initially excludes companies with operations in fossil fuels, gambling, tobacco, weapons, animal cruelty, alcohol and boards with zero gender diversity.

From the remaining companies available, “sustainability leadersare identified. To be classed as a sustainability leader, a company must either:

  • derive more than 20% of revenue generated from a range of industries including renewable energy, water efficiency, recycling, waste remediation, transport, education, healthcare, social services and social infrastructure or,
  • recipient of either an “A” or “B” grade rating from a trusted ethical consumer report (Ethical Consumer Guide, Baptist World Aid Behind Barcode) or,
  • certified B Corporation (B Corp)

To ensure diversification, each sector is capped at 10 companies. Sustainability leaders are given preference before companies from the broader universe.

Performance and benefits

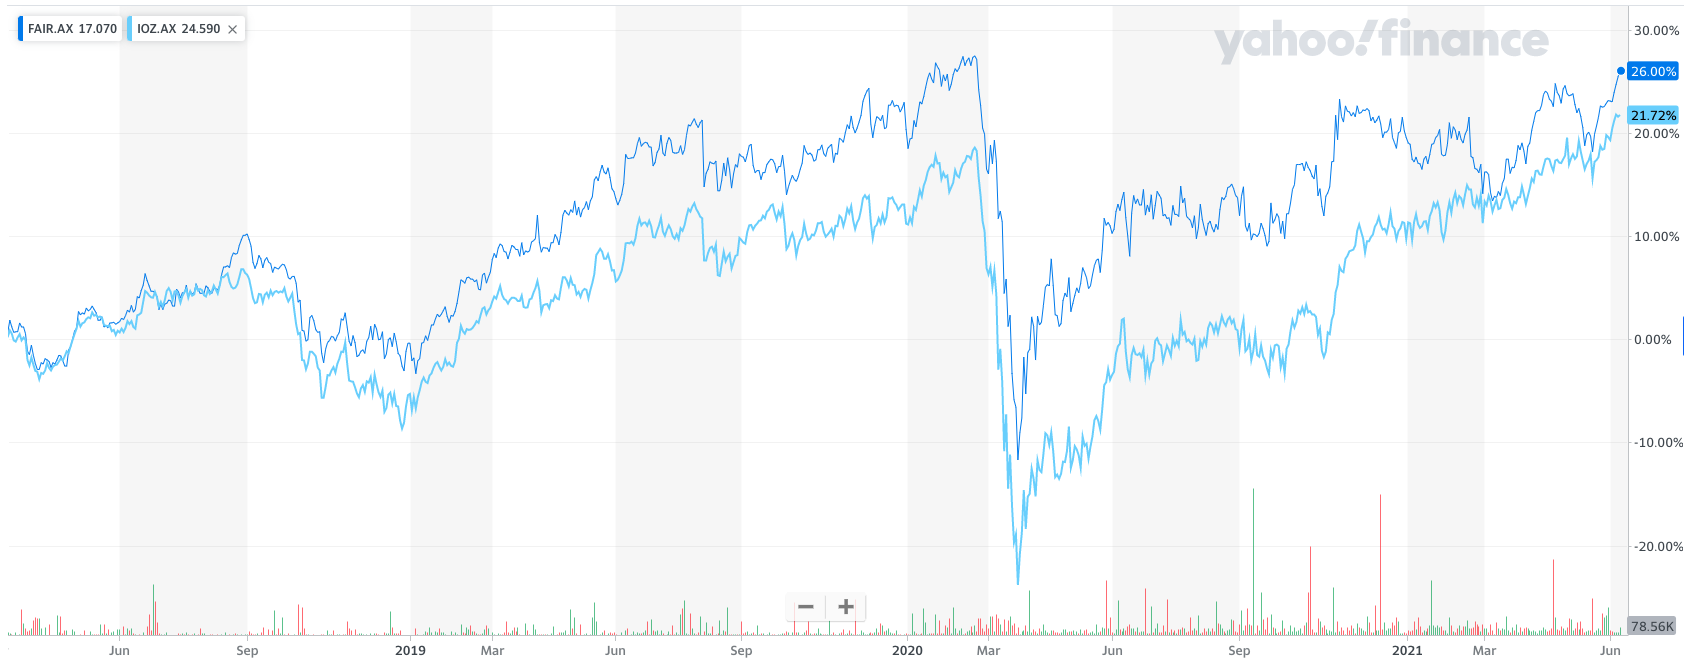
The below graph compares the performance since March 2017 of FAIR and IOZ. FAIR has outperformed IOZ, in addition to falling relatively less when the market slid on news of COVID-19 in March last year.

FAIR vs IOZ Price Chart. Source: Yahoo Finance
IOZ has a longer product history than FAIR. Over the past ten years, IOZ has returned 8.55% per annum.
IOZ pay distributions to holders every three months and has a trailing yield of 2.01%. FAIR distributes only every six months but has a higher yield of 2.5%.
Financials (30.5%), Materials (20.1%), Health Care (9.9%) are the three major sector weightings within IOZ. Conversely, FAIR major sector weightings are Health Care (25.4%), Real Estate (19.0%) and Financials (17.0%)

Fees and risks

FAIR charges an annual management fee of 0.49% compared to an annual management fee of 0.09% for IOZ.

This may not seem much of a difference in the short run, however the 40 basis point difference in fees each year adds up over time.

Below is a chart illustrating if you were to invest $10,000 into both FAIR and IOZ today, what the closing balance would be in 2051. For simplicity, each ETF is assumed to return 8% per annum for 30 years.

FAIR vs IOZ Fee Comparison. Assumed a return of 8% per year for 30 years.

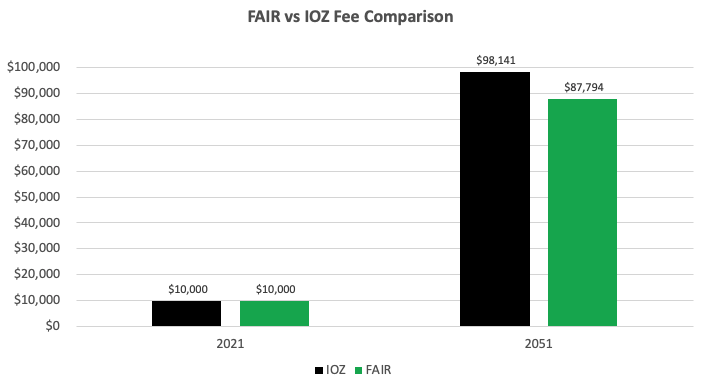
In 2051, the IOZ closing balance would be $98,141 and the FAIR closing balance is $87,794. That’s a difference of $10,347!

Both ETFs focus on Australia (2% share of global markets), therefore, underrepresenting the remainder of the worlds. To gain exposure to the other 98% of world markets, investors will require ETFs, which have a more broad geographic mandate.

My take

Personally, I prefer IOZ primarily for its lower management fee. For a broad ethical Australian ETF, I prefer Vanguard Ethically Conscious Australian Shares ETF (ASX: VETH).

$50,000 per year in passive income from shares? Yes, please!

With interest rates UP, now could be one of the best times to start earning passive income from a portfolio. Imagine earning 4%, 5% — or more — in dividend passive income from the best shares, LICs, or ETFs… it’s like magic.

So how do the best investors do it?

Chief Investment Officer Owen Rask has just released his brand new passive income report. Owen has outlined 10 of his favourite ETFs and shares to watch, his rules for passive income investing, why he would buy ETFs before LICs and more.

You can INSTANTLY access Owen’s report, and 24/7 access to the Rask community, for FREE by CLICKING HERE NOW or the button below.

Unsubscribe anytime. Read our TermsFinancial Services GuidePrivacy Policy. We’ll never sell your email address. Our company is Australian owned.

At the time of publishing, Lachlan does not have a financial or commercial interest in any of the ETFs mentioned.

Information warning: The information on this website is published by The Rask Group Pty Ltd (ABN: 36 622 810 995) is limited to factual information or (at most) general financial advice only. That means, the information and advice does not take into account your objectives, financial situation or needs. It is not specific to you, your needs, goals or objectives. Because of that, you should consider if the advice is appropriate to you and your needs, before acting on the information. If you don’t know what your needs are, you should consult a trusted and licensed financial adviser who can provide you with personal financial product advice. In addition, you should obtain and read the product disclosure statement (PDS) before making a decision to acquire a financial product. Please read our Terms and Conditions and Financial Services Guide before using this website. The Rask Group Pty Ltd is a Corporate Authorised Representative (#1280930) of AFSL #383169.