
Kerry Craig is the Chief Market Strategist at J.P. Morgan Asset Management based in Melbourne. Every month he publishes economic update, filled with charts and analysis. It’s a ‘must read’ for long-term investors interested in the economy. We’re thrilled to reshare his analysis with Best ETFs readers.
This excellent monthly piece is contributed by Kerry Craig of JP Morgan Asset Management. To view monthly insights from Kerry, and see all of his charts, you can visit the JP Morgan website. Kerry recently appeared on The Australian Investor Podcast.
Bond and equity bulls lost the fight against the bears and July’s rally was unwound in August and September.
Market volatility was particularly pronounced at quarter end as events in the UK reverberated around the world. Developed market equities were down 8.3% over the September month and -4.3% for the quarter, while global bond markets fell 5.1% and -6.9% respectively.
The July rally was based on a perceived pivot from the U.S. Federal Reserve (Fed) and expectation of rate cuts in 2023. However, by the time of the Jackson Hole summit in August, the Fed and other central banks squashed this notion, reiterating their commitment to controlling inflation even at the expense of economic growth. This was the driving factor of the sharp rise in bond yields and sell-off in stocks in the second quarter as investors priced in the most aggressive rate hiking cycle in decades. At least, until the new UK government outlined their fiscal package.
The proposed unfunded fiscal package from the new UK government further rattled markets at month end. The sustainability of the government’s fiscal position in a higher rate environment was brought into question as the countries debt-GDP ratio already sits close to 100%. Meanwhile, the inflationary consequences of a big fiscal outlay at a time when UK inflation is just shy of 10% year-over-year (y/y) and the Bank of England (BoE) was about to begin actively selling down the bonds on its balance sheet, which ran very much counter to market expectations.
UK government borrowing costs rose so rapidly following the announcement the BoE was forced to reverse course and once again purchase bonds to stabilise the market. The yield on 10-year UK Gilts ended the quarter at 4%, 180bps higher than at the start.
Despite the tough talk, global inflation pressures are starting to moderate as energy and food prices come down. The price of Brent oil has fallen by 30% since June and the Food and Agriculture Organisation world food price index fell to its lowest level since the war in Ukraine. Furthermore, supply chains are improving as goods’ demand slows and supply improves.
The trade-off between growth and inflation is becoming more apparent as financial conditions tighten and the probability of a policy-induced recession increases. The global Purchasing Managers’ Index (PMI) for manufacturing fell below 50 in September indicating a possible contraction to come. Recession or no recession, the global economy is in for a period of sub-trend economic growth in the year ahead.
Economy:
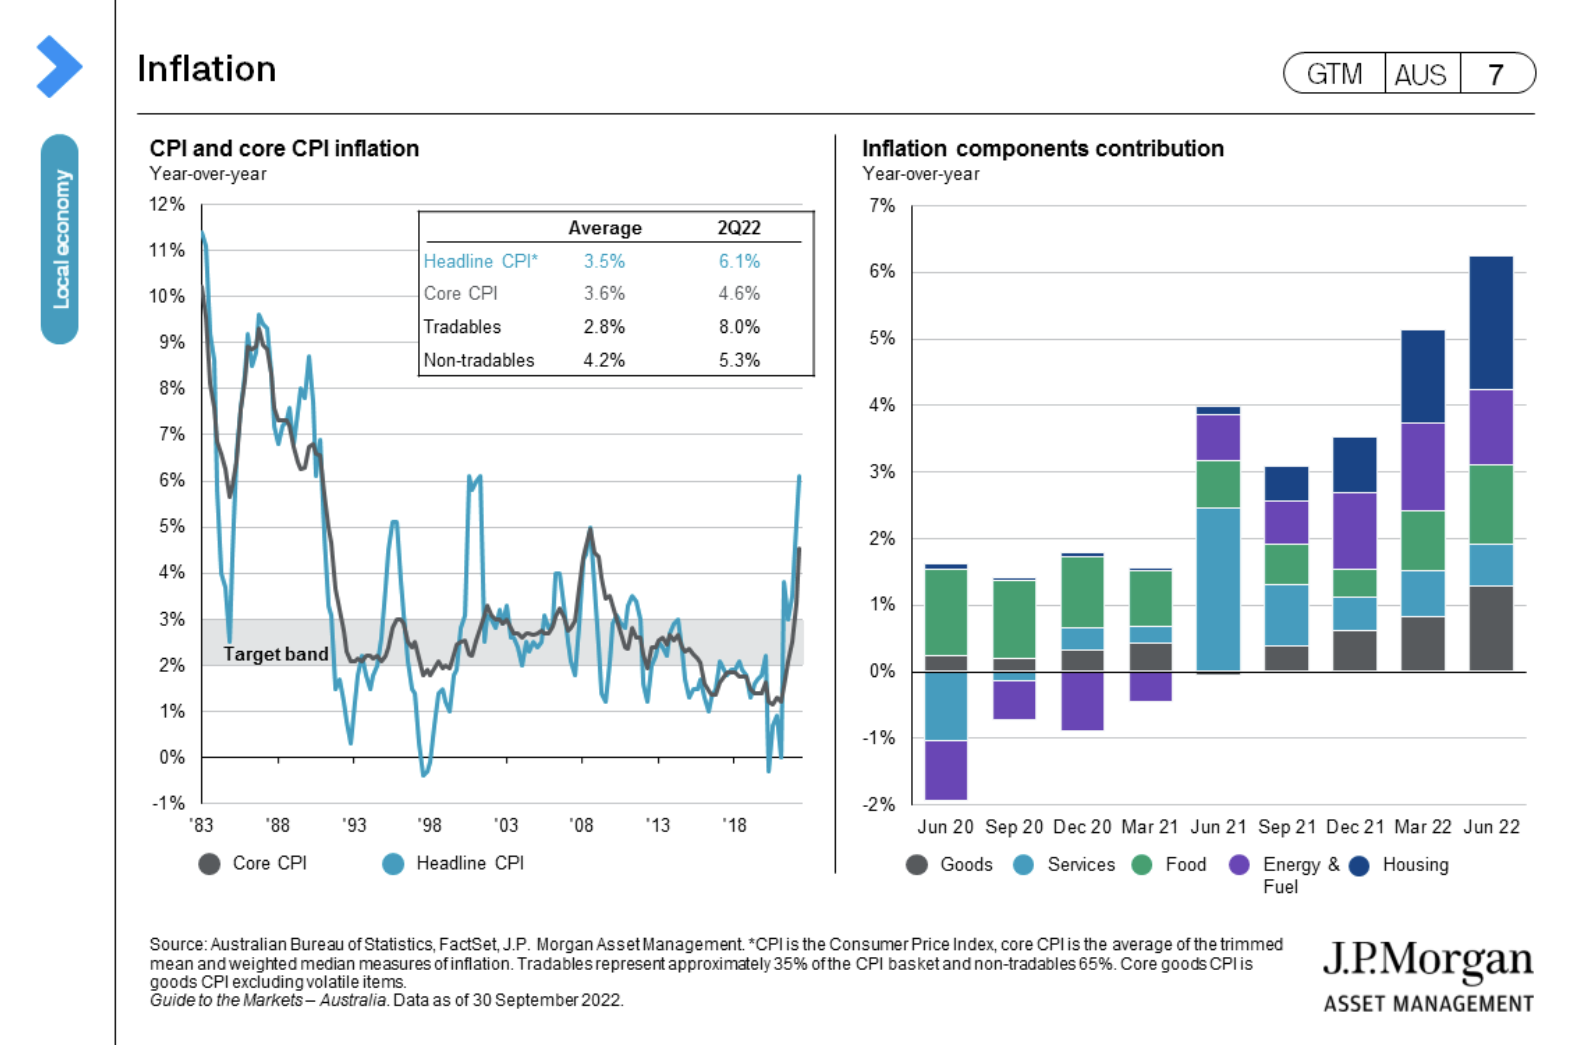
- The Australian Bureau of Statistics began publishing a monthly series for inflation this month. While this is not an official series or used for the Reserve Bank of Australia’s (RBA’s) decision-making process, it will provide a more real time view of inflation pressures in the economy. The data behind the figure comes with heavy caveats but the first data point suggested that inflation pressure was lower than many expected. The figure suggested that inflation was tracking 6.9% in August.
- Retail sales remained upbeat for August (+0.6% month-over-month) even if the y/y comparison was inflated by the COVID measures from a year ago. This suggests that household spending has, so far, been resilient to higher mortgage rates. However, this pace of consumption may not be sustainable, and we expect it to slow in the months ahead. (GTM AUS page 5)
- Business outlook remains robust as well. Both the business condition and confidence indices showed further strength in the August data.
- The tightness in the labour market means the slowing in consumption will likely be gradual rather than abrupt. Even with the small tick up in the unemployment rate in August to 3.5%, demand for labour remains strong and the participation rate near all time highs. (GTM AUS page 8)
- One area where tighter monetary policy is having an effect is the housing market. Nationally, house prices have declined for five consecutive months and the drawdown from the peak is 5.5%. Lending growth and financing continues to slow suggesting further weakness ahead. (GTM AUS pages 10-11)
- The slowing pace of economic activity is not uniform across the world. The complete set of manufacturing PMI indices show the divergent growth profile between Europe, which is plagued by the energy crisis, and north Asia, which is more susceptible to the slowing goods demand from developed markets and the surprising and ongoing resilience of the U.S. economy despite all the shocks this year. (GTM AUS page 15)
Equities:
- The ASX 200 eked out a 0.4% gain across the second quarter but was down 6.2% for the September month. This was still better than the 9.2% decline in the S&P 500 and the similar 9.3% drop in emerging markets for the month (-4.9% and 8.0% for the quarter respectively).
- For the September month, every sector was in red for the first time since March 2020. Materials was the least-worst performer (-2.3%), followed by energy (-3.8%) and healthcare (-4.4%). The biggest decliners were utilities (-13.8%), REITs (13.6%), followed by IT (-10.6%) and industrials (-9.8%).
- Equity valuations ended September sharply lower than at the start of year. However, the question for investors has shifted from “are things too expensive” to “are things cheap enough”? The potential for earnings downgrades and little support from valuations as rates rise suggests not.
- However, while earnings downgrade cycle is further progressed for Asia Pacific ex-Japan equities, the weakness in the trade outlook and the strength of the U.S. dollar will be headwinds to index level performance.
Fixed income:
- Central banks went on the offensive in the third quarter with 150bps in hikes from the Fed, 150bps from the RBA, 125bps from the European Central Bank and 100bps from the BoE. (GTM AUS page 53)
- The result was a sharp rise in bond yields, the 10-year Australian government bond yield rose by 83bps to 3.89% while the U.S. 10-year Treasury yield rose by 116bps to 3.80% over the quarter. (GTM AUS page 50)
- Credit spreads continue to confound investors as they remain relatively tight and reflect less risk of recession than equity markets. While spread did widen over the quarter, they are not yet at a level that may be attractive to investors given the economic risks. (GTM AUS page 51)
Other assets:
- The U.S. dollar dominance continued in the third quarter supported by both a flight to safety given the weakening growth outlook and the widening expectations around interest rate between the U.S. and the rest of the world. On a cross rate basis, the U.S. dollar gained 7% on the Aussie dollar, 6.5% on Japanese yen, 6.7% on the euro and 8.8% on the British sterling. (GTM AUS page 67)
- The performance of gold has been choppy but is succumbing to the pressure of a higher U.S. dollar and rising real yields. (GTM AUS page 65)
- The decline in the oil price is easing inflation pressure as expected demand fall and the higher U.S. dollar lowers the price and the price of a barrel of Brent crude is down 30% from its recent June peak. (GTM AUS page 62)
The information in this post is limited to general financial information only and, therefore, should not be relied upon. The information is not intended as financial advice and so you should consider getting the advice of a licensed and trusted financial professional before acting on this information. To learn more about J.P. Asset Management please click here.