The VanEck Australian Resources ETF (ASX: MVR) is a popular ETF, with over $330 million of net assets as of February 2023. However, it’s quite a bit smaller than the biggest ASX-focused resources ETF, the Vanguard Australian Shares Index ETF (ASX: VAS).
The MVR ETF is not one of the cheapest ASX ETFs. It has a yearly management cost of 0.35%. So, with a $10,000 investment, the annual cost is $35 of management fees. That’s not bad (the ASX ETF average fee is ~0.49%), so there are plenty of ETFs that are more expensive.
💡 Remember, the fee for MVR doesn’t come out of your bank account. The ETF provider, in this case, VanEck, takes a small cut out of the fund’s value every day, automatically. See our video explainer for ETF fees and taxes.
The MVR ETF isn’t the cheapest ETF that tracks the resources sector on the ASX. Both the Australian Resources Sector ETF (ASX: QRE) and SPDR S&P/ASX 200 Resources ETF (ASX: OZR) have annual management fees of 0.34%. The names in all three ETFs (MVR, OZR, QRE) are quite similar, though the QRE ETF and OZR ETF have a huge weighting to BHP Group Ltd (ASX: BHP), around 40%, whereas the MVR ETF is much more evenly balanced.
The expense ratios are almost identical, so the cost shouldn’t be the deciding factor.
 A quick note: To discover which ETFs are our favourite, please consider becoming a premium member of Rask Core
  , where we provide members with our best ETFs, research on ASX-listed funds and our highest conviction ASX share ideas — for only $9.99 per month (cancel anytime!). But before you click away, please enjoy this free analyst report and then (if you like it) you can consider joining us. Click here to join.
The MVR ETF is built to track the MVIS Australia Resources Index which, according to VanEck, is a pure-play rules-based Australian sector index that tracks the performance of the largest and most traded ASX-listed companies which are generating at least 50% of their revenues or assets from the Australian resources sector.
This is somewhat similar to the index that the SPDR S&P/ASX 200 Resources tracks, which is all about investing in the resources businesses included the S&P/ASX 200 Index (ASX: XJO).
Within the ASX 200, BHP is such a big part of the resources industry. However, in the MVR ETF portfolio, BHP had an allocation of around 8.1%, as of February 2023. Meanwhile, the Woodside Energy Group Ltd (ASX: WDS) weighting was 7.9%, the Rio Tinto Limited (ASX: RIO) allocation was 7.3%, and so on.
In other words, the companies inside the ETFs are the same. It’s the position sizing — distributed more evenly — that separates MVR.
There are two main alternatives to the MVR ETF:
MVR owns a number of the same ASX resource shares that are already inside the main ASX ETFs, such as Vanguard Australian Shares Index ETF (ASX: VAS).
However, the MVR ETF lacks the sector diversification of some of the most effective ETFs, such as VAS, or the Vanguard MSCI Index International Shares ETF (ASX: VGS).
Therefore, we believe it probably shouldn’t be considered a Core, long-term, “bottom-drawer” ETF on its own. And you should carefully consider if it needs to be inside your portfolio if you already own the VAS ETF, or other popular Australian shares ETFs.
That said, with Australian resources businesses typically being good performers on the global stage over the long run, MVR could be combined effectively with other ETFs focused on the global/US share market that provides exposure to different areas. Just be mindful of the ‘overlap’ between your ETF holdings.
Investors may like the dividends and franking credits offered by the resources sector. However, MVR is heavily focused on a few key commodities like iron, oil and gas and gold because of the nature and size of businesses on the ASX.
Keep in mind that the MVR ETF has very similar holdings to QRE and OZR, so there could be unnecessary overlap if an investor holds more than one of these investments.
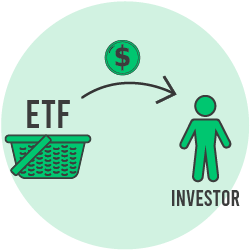
The ETF structure acts as a conduit to ‘pass on’ dividends and franking credits from the shareholdings (e.g. BHP, RIO, etc.) to the investor of the MVR ETF. The dividends from those businesses effectively decide the dividend yield of the MVR ETF itself.
Investors may think of resource businesses as ‘cashflow machines’. For example, when commodity prices are quite high, the dividends from the mining companies and the MVR ETF will be high, with franking credits on top of the cash dividends. Over the last five years, the cash (excluding franking) income return from MVR has been an average of 4.2% per year.
Remember that in Australia ETFs are required to pay back ‘capital gains’ as well as dividend income from companies. So, when an ETF’s distribution is paid to ETF investors you will receive an ‘income’ amount (from the dividends generated by companies inside the MVR ETF) and capital gains (from buying and selling by the ETF). Therefore, the ‘historical yield’ figure amount is not a true reflection of the sustainable income potential of an ETF because you are, in effect, getting some of your investment back.
Lesson: the sustainable amount of income an ETF will generate over many years should exclude capital gains amount paid back to investors as they are not always tax effective.
Practical tip: study the types of distributions paid by an ETF, consider the types of companies it is invested into, and do not rely solely on the ‘historical yield’ figures on our website, the ETF provider’s website or the ASX website.
We believe the risk level of the MVR ETF is at a higher end of the range when compared against more diversified and broad-based Australian shares ETFs, such as VAS or iShares S&P/ASX 200 ETF (ASX: IOZ). And compared to bonds, the MVR ETF is likely to be much more volatile, which is seen as riskier, over the long run. Therefore, we believe it should be considered a high risk and long-term (7+ years) investment.
Within its peer group, we believe the MVR ETF may be considered lower risk than QRE and OZR because the holdings are more evenly distributed. Furthermore, Australia is seen as a relatively safe mining jurisdiction, compared to global peers, so MVR could be judged as lower risk than ETFs focused on mining companies from other parts of the world.
While a number of ASX miners may be leaders at what they do, investors may want to diversify a holding of MVR with an investment option, or options, that provide exposure to the international share market and different sectors. For example, the MVR ETF has different risks to other thematic ETFs like CLDD and ESPO, but a diversified portfolio can mitigate some of the sector-specific volatility.
To view the full range of ETFs available on the ASX, click here. Or to join us inside Rask Core 🌏 and get all of our premium ASX research and model portfolios, click here.